Learn › Topics › Data and graphs
Topic guide
Data and graphs
Data is information we collect to answer a question, such as "what is the most popular fruit in our class?". Usually it is a set of numbers or a set of answers we can count. Charts, graphs and tables organise the data so we can spot the answer and any patterns. In the National Curriculum this topic is called statistics, and it starts in Year 2.
What children learn, year by year
This follows the National Curriculum in England. US grades are roughly one year behind the UK year number.
| Year | What they learn |
|---|---|
| Reception and Year 1 | No data topic yet, but sorting things into groups and counting each group (toys by colour, buttons by size) is where it begins. |
| Year 2 | Read and make simple pictograms, tally charts, block diagrams and tables. Answer questions by counting each group, putting groups in order of size, finding totals and comparing. |
| Year 3 | Bar charts, pictograms and tables, including scaled ones where one picture or one step stands for 2, 5 or 10. One-step and two-step questions, like "how many more chose cats than dogs?". |
| Year 4 | Choose a good way to show data, including bar charts and time graphs. Meet discrete data (things you count) and continuous data (things you measure). Comparison, sum and difference problems. |
| Year 5 | Read and answer questions about line graphs. Complete, read and use tables, including timetables. |
| Year 6 | Read and draw pie charts and line graphs, and use them to solve problems. Work out the mean as an average and say what it tells you. |
The big ideas
1. Data starts with a question
Charts are not pictures for their own sake. Every set of data answers a question, and the work goes round in a loop: ask a question, collect the data, organise it, show it, then read it to answer the question (which often leads to a new one). Letting your child choose the question, "which colour car goes past most often?", makes the rest of it matter to them.
2. Tally marks count in fives
A tally chart records things as they happen, one mark each time. Every fifth mark goes across the four before it, making a bundle of five. To read the total, count the bundles in fives and then add the single marks: 5, 10, 15, 16, 17.
3. Always read the key and the scale
In Year 2 each picture in a pictogram, and each block in a block diagram, stands for one thing. From Year 3 one picture can stand for more: if the key says one smiley face means 2 children, then half a face means 1 child, and 3½ faces means 7 children. On a bar chart the scale up the side might go up in 2s, 5s or 10s, so a bar ending halfway between 10 and 20 shows 15. The first question to ask about any chart is "what does one picture, or one step, stand for?".
Ask three kinds of question about any chart. Read it: "how many chose bananas?" Compare it: "how many more chose grapes than bananas?" Think about it: "why might grapes be so popular? Would a different class give the same answer?" The third kind is the one children get least practice with, and it is where real understanding shows.
4. Line graphs show change
A line graph shows how something changes, usually over time: the temperature through a day, or a sunflower's height each week. The points are joined because the values in between make sense: there really was a temperature at 10:30, even if nobody measured it. That is why we don't join the tops of the bars on a chart of favourite fruit. There is nothing halfway between "apple" and "banana".
5. Pie charts show parts of a whole (Year 6)
A pie chart is a circle split into slices, each showing what fraction of the total is in that group. Children link it to fractions and angles: the whole circle is 360°. If 24 children answer a question, each child gets 360° ÷ 24 = 15° of the circle. So if 6 children chose football, their slice is 6 × 15° = 90°, a right angle, which is a quarter of the circle (6 out of 24 is ¼).
6. The mean is a fair share (Year 6)
The mean is one kind of average. Add up all the values, then divide by how many values there are. Four children score 4, 7, 6 and 3 in a game: 4 + 7 + 6 + 3 = 20, and 20 ÷ 4 = 5, so the mean score is 5. Think of it as evening out: if all the points were shared fairly, everyone would have 5.
Common mistakes to look out for
- Ignoring the scale: counting each line on the axis as 1 when the scale goes up in 2s or 5s.
- Missing the key: counting pictures on a pictogram when each picture stands for 2 or 10.
- Miscounting tallies: reading a bundle of five as 4 or 6, or drawing the fifth mark as an upright line.
- Uneven scales when drawing: spacing 0, 5, 10, 20 equally up the axis, or starting the bars above zero.
- Joining the dots on everything: using a line where the groups have nothing in between them.
- Dividing by the wrong number for the mean: for scores of 0, 5 and 7 the mean is 12 ÷ 3 = 4, not 12 ÷ 2 = 6. A score of 0 still counts.
- Comparing pie charts with different totals: half of 100 people is more than half of 20 people, even though the slices look the same.
Five-minute data games for home
- Car colour tally. On a journey or from a window, tally the colours of the next 30 cars. Which colour won? By how many?
- Family survey. Let your child pick a question ("favourite pudding?"), ask everyone, then draw a pictogram or block diagram on the fridge.
- Laundry block diagram. Sort the clean washing into socks, tops and trousers, stack each pile and compare. That is a block diagram in real life.
- Weather watchers. Check the outdoor temperature at the same time each day for a week, then draw a line graph together.
- What's the question? Show a chart from a newspaper, a cereal box or a weather app and ask: what question does this answer? What does it not tell us?
- Dice means. For Year 6: roll a dice five times, find the mean, then roll again. Does the mean stay about the same?
Indie's challengeIndie drew a pictogram where one honey pot stands for 4 bees. The daisy row has 3½ honey pots. How many bees visited the daisies? Show the answer
3 whole pots stand for 3 × 4 = 12 bees. Half a pot is half of 4, which is 2 bees. So 12 + 2 = 14 bees visited the daisies.
Free data and graphs worksheets
Print these for practice at home or in class. Each one has an answer sheet on the second page.
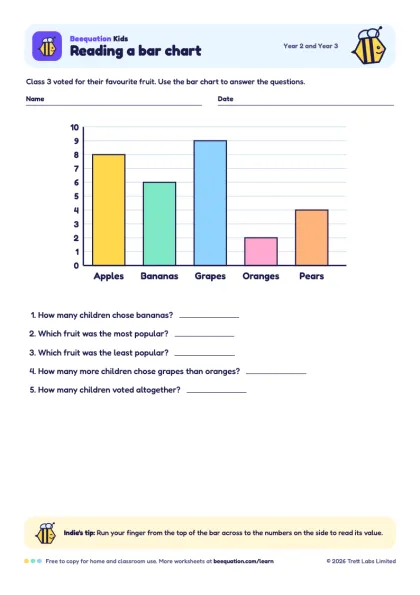 Reading a bar chartYear 2, Year 3 · Favourite fruit surveyDownload PDF
Quick answers
A table for counting as you go. You make one mark for each thing, and every fifth mark crosses the four before it, so you can count the marks in fives.
In a block diagram each block stands for one thing, and you count the blocks (Year 2). In a bar chart each bar is read against a scale up the side, which can go up in 2s, 5s, 10s or more (Year 3 onwards).
Discrete data is counted and has gaps between the possible values, like the number of pets (you can't have 2½ dogs). Continuous data is measured and can take any value in between, like height, time or temperature. Children meet the words in Year 4.
Add all the values together, then divide by how many values there are. The mean of 2, 4 and 9 is 15 ÷ 3 = 5.
In Year 6 (age 10 to 11), once they know about fractions, percentages and angles. Questions about tables and graphs also turn up in the Key Stage 2 SATs reasoning papers.
Practise with Indie
Beequation Kids turns number facts into honeycomb puzzles, with Indie giving a hint when a child is stuck. No ads and no data collected.